
César González Segura
A workshop to help your team navigate legacy software
Posted February 17th 2026
Did you enjoy this article? Follow the conversation on LinkedIn
The importance of properly maintaining legacy software
If you have been around software engineering communities for a while, you will be aware of the reputation of legacy software.
Many engineers associate it with fragile codebases, built over years of decisions nobody understands anymore.
The reality is that in many cases, legacy software is what keeps businesses afloat. Silently processing
millions of transactions on a daily basis, generating revenue and providing value to users.
As time passes, software starts decaying. Team members come and go, institutional knowledge gets lost and its supporting
architecture dillutes.
At the same time, there's little incentive from the business side to modernize it. If it keeps working, why spend precious
resources on modernizing it? Well, because at some point, it will stop working.
In one of my previous teams, we were facing way too many issues at the same time. We were in charge of many legacy products and services, and
we had to modernize them fast.
With our limited time and resources, we wouldn't be able to do it all on time. So the question was: what's prioritary?
As a way to help us get out of the deadlock we were in, we built this workshop that helped us define
what had to be fixed, and in which order, to ensure we would be able to adapt on time to the business needs.
Introduction to the workshop
The objective of this workshop is to help your team:
- Understand the most pressing issues with your legacy services are.
- Plan what to fix first to ensure business continuity.
- Share knowledge about legacy systems with the whole team.
The workshop consists of two sessions, taking around two hours each. It's important
that most of your team members are able to attend the workshop.
Preparation work for both sessions can take around another 2-3 hours before each session. You can do
the prep work by yourself with help from other team members.
To get the most out of the workshop, it's best to limit the number of attendees to under 10 people.
You want to ensure everybody has enough time and space to contribute.
The purpose of the two sessions is:
- Mapping service health
- Understanding the technical health of the services maintained by your team.
- Outcome → Know the health of your services.
- Mapping business / service relevance
- Understand the business relevance of your team's services, and detect problems.
- Outcome → Know what services are worth fixing from a business point of view.
By the end of the workshop, you should have a picture of what product features could be at risk due to problems
in the legacy services backing them, and which should be solved first.
Setting up an example case study
To illustrate how the workshop could be run with a concrete example, let's introduce an imaginary product and its stack.
Let's assume we have an e-commerce platform, backed by several in-house services and other off-the-shelf or external SaaS
services.
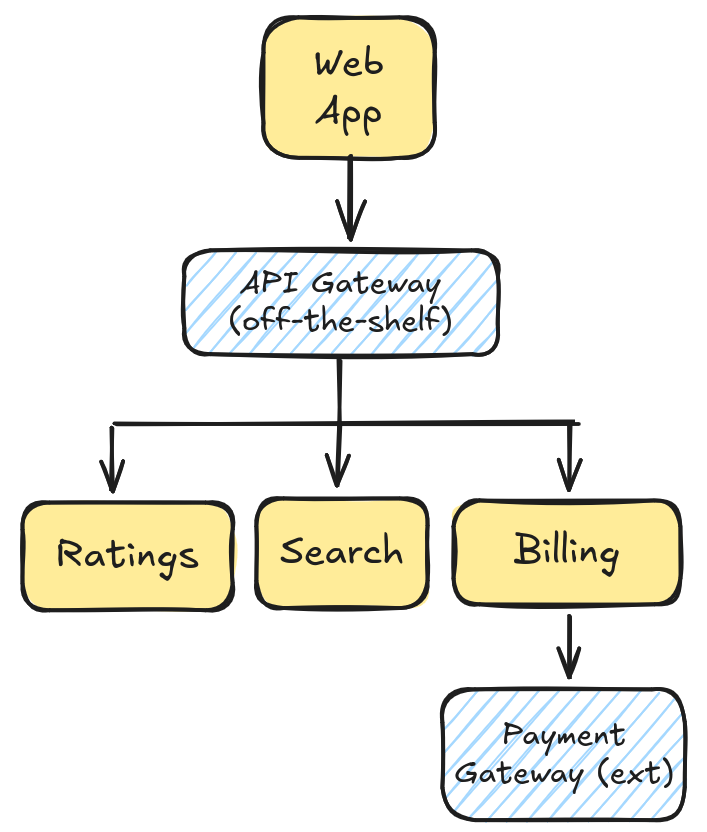 Service stack in our platform.
In this workshop, we will focus on in-house services, ignoring off-the-shelf and external components of the
system.
Session #1 - Mapping service health
This session helps the team reflect about the services they take care of, and evaluate their health.
A 2~3 hour slot should suffice for this session, but you will have to prepare it first.
The team will have to describe their services through metrics. These metrics can be either quantitative
or qualitative.
Preparing the workshop materials with a team member who has deep knowledge about your services helps a lot.
They can provide insights to define meaningful metrics to describe them.
Metrics have a score, mapping their health from best case to worst case. We used a simple scoring system ranging 1~4,
together with a color code to help us map metrics in a digital whiteboard:
- 1 (▣) - Ideal → As good as it can be.
- 2 (▣) - Acceptable → Rough around its edges, but perfectly manageable.
- 3 (▣) - Worrying → Problems are becoming apparent, and could get worse.
- 4 (▣) - Danger → We are not ready to react if something unexpected happens.
Once these metrics are ready, we'll set-up a service / health matrix in our digital whiteboard to let the team discuss and
assign a score to each service.
Start by creating a matrix with all the services, and one by one, let the team
decide which score makes more sense for each:
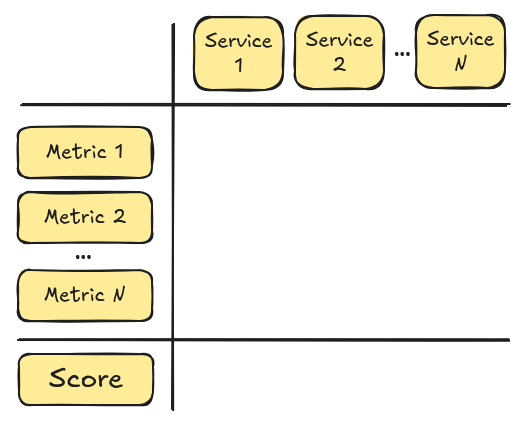 Start with all your services, and the metrics you have chosen.
Then, start a discussion for each service and start assigning a score to each metric. As we'll see in the next section,
some metrics will be objectively measurable, while others will raise a more heated debate.
Assign a score from 1~4 (green to black, or the color palette of your liking), and finally assign the aggregated score for each of
them. A simple scoring formula that worked well is ceil(avg([scores])).
This formula highlights bad scores, ensuring that scores of services with poorly scoring metrics get in the spotlight. This helps to bring attention
to services that need it.
Let's add the scores for the metrics and calculate the score for each metric:
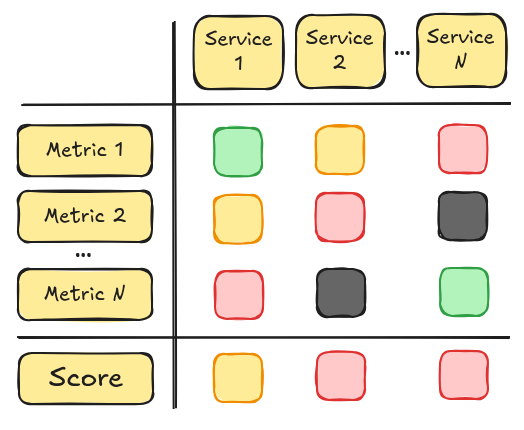 All services have been evaluated and assigned a score.
With these results, we have a bird's eye view of the technical health of our services, split by metric. To make it work,
we will have to define which metrics can be used to measure its health.
In the next section, you'll find some example metrics that you can use in your own workshop. And later,
we'll review the example case study with a set of metrics.
Quantitative metrics
Quantitative metrics are those that can be measured from objective data. These can be
useful to determine how far your team's services are from the goals set by your organization,
upcoming regulatory requirements, industry standards, etc.
For each metric, you should define the measurable points and/or thresholds to set
the metric's score. For example, consider a metric with four yes/no questions, where "yes" is
positive (you want to fulfill all items).
In this case, having a "yes" answer to all points would score a 1 (▣),
having a "yes" to three out of four would score a 2 (▣), and so on.
Here are some examples you can use as a starting point. Some of these metrics can be answered on a
yes/no basis, others require gathering actual numbers:
-
Obsevability
- Are our systems observable from the outside?
- Are there alarms in place to notify the team in case there is a production failure?
- Is the team able to understand the current state of the system by checking logs and traces?
- Are performance measurements available for our systems?
-
Security
- Do our systems use libraries or frameworks with known security vulnerabilities?
- Are we running security scanning processes on our systems?
- If so, is the team actively patching found security vulnerabilities?
- Does the team follow security best practices? (masking PII data in logs, properly storing sensitive data and secrets, etc)
-
Up-to-dateness:
- Are any of our systems using frameworks or libraries out of their maintenance window?
- Are any systems using frameworks that could complicate updating to modern versions if needed? (ex. NET Framework, PHP 5...)
- Do our systems comply with all applicable regulations?
-
Scalability
- Is the team aware of how our services perform under load?
- Does the architecture of the systems allow scaling them up when required?
- Can the team scale them autonomously, or do we need support or permission from other teams?
- Are there auto-scaling measures in place?
- Do we perform regular load testing on our services?
-
Failure Rate
- How often does the service suffer from critical bugs?
- Does the service go down? If so, how long does its recovery take?
- Is the service part of the critical path? Can the business continue operating during downtime?
Qualitative metrics
Qualitative metrics work great to help your team assess how they "feel" when working with
their systems. Discussing metrics without factual data to back them might seem counterproductive,
but in some cases trying to express all problems with hard numbers complicates debate.
Some qualitative metrics you can use are:
-
Extendability
- How easy is it to add new features to our service?
- Are we held back by its architecture and/or design?
- Do we avoid extending the service beyond surgical changes due to accumulated tech debt?
-
Testing quality
- Are the tests backing our service easy to read and understand?
- Do we trust the results of our tests?
- Is it easy to create new tests?
- Does our test codebase break easily when adding new features?
There are always objective ways of measuring these metrics with hard data. But in many
cases the debate around these topics is much more valuable to understand the general
"vibe" of working with these services than hard numbers by themselves.
For example, you could assess testing quality quantitatively by measuring the code base's coverage,
the presence of flaky tests or the time required to execute a full test suite.
But if the architecture supporting these tests makes creating new tests or extending existing
tests a chore, the team will have an easier time expressing this pain point from a feelings
point of view. Even if from a numbers perspective, everything seems to be okay.
Session #1 - example case study
Let's go back to our example case study, and define which metrics are most relevant for our services, and how
to measure them.
Our service matrix will consist of the four key services our team manages (excluding off-the-shelf
components). To measure their health, we will use four metrics, two qualitative and two quantitative:
-
Extendability: How easy is it to extend the service with new features?
- 1 (▣) → Extending the service with new functionality is seamless. Adding new features and improvements takes minimal time.
- 2 (▣) → Adding new functionalities can get cumbersome without refactoring first.
- 3 (▣) → The codebase has grown without regard to its architecture, and adding new features is time consuming and a potential risk.
- 4 (▣) → Adding new features is very time consuming, and requires extensive prior clean up through refactoring.
-
Testing Quality: How good are the tests supporting development of the service?
- 1 (▣) → Tests are well maintained, comprehensive and robust. Includes functional and non-functional testing, stress tests, etc...
- 2 (▣) → There is decent test coverage, but their design makes them prone to breaking.
- 3 (▣) → There are some tests, but not coverage isn't good enough to allow changes without risk.
- 4 (▣) → There are no tests, and adding new tests would take a lot of effort at this point.
-
Failure Rate: How often does the system fail? How long does it take to recover?
- 1 (▣) → Less than 5 critical incidents YoY. MTTR under 30 minutes.
- 2 (▣) → ~10 critical incidents YoY. MTTR under 30 minutes.
- 3 (▣) → ~10 critical incidents YoY. MTTR over 30 minutes.
- 4 (▣) → ~4 critical incidents / week. MTTR over 30 minutes.
-
Security & Up-to-Date: Are its dependencies (including frameworks) up to date? Have security vulnerabilities been detected?
- 1 (▣) → Zero critical security vulnerabilities. Dependencies use latest stable versions.
- 2 (▣) → Zero critical security vulnerabilities. Dependencies use older but still supported stable versions.
- 3 (▣) → Active critical security vulnerabilities present. Dependencies use older but still supported stable versions.
- 4 (▣) → Active critical security vulnerabilities present. Dependencies use deprecated versions.
Now that we have a set of metrics to measure the health of our team's services, we can build the service / metric health matrix
and start filling in the score for each metric.
We can leverage logs, performance metrics, reports from the package manager, security vulnerability analysis tools and post-mortem documentation
from previous failures and incidents, etc...
On the other hand, extendability and testing quality metrics will involve a deeper discussion between the developers in the team. How was the
experience of building the latest features in each service? Was it easy, or did we try to avoid it at all costs?
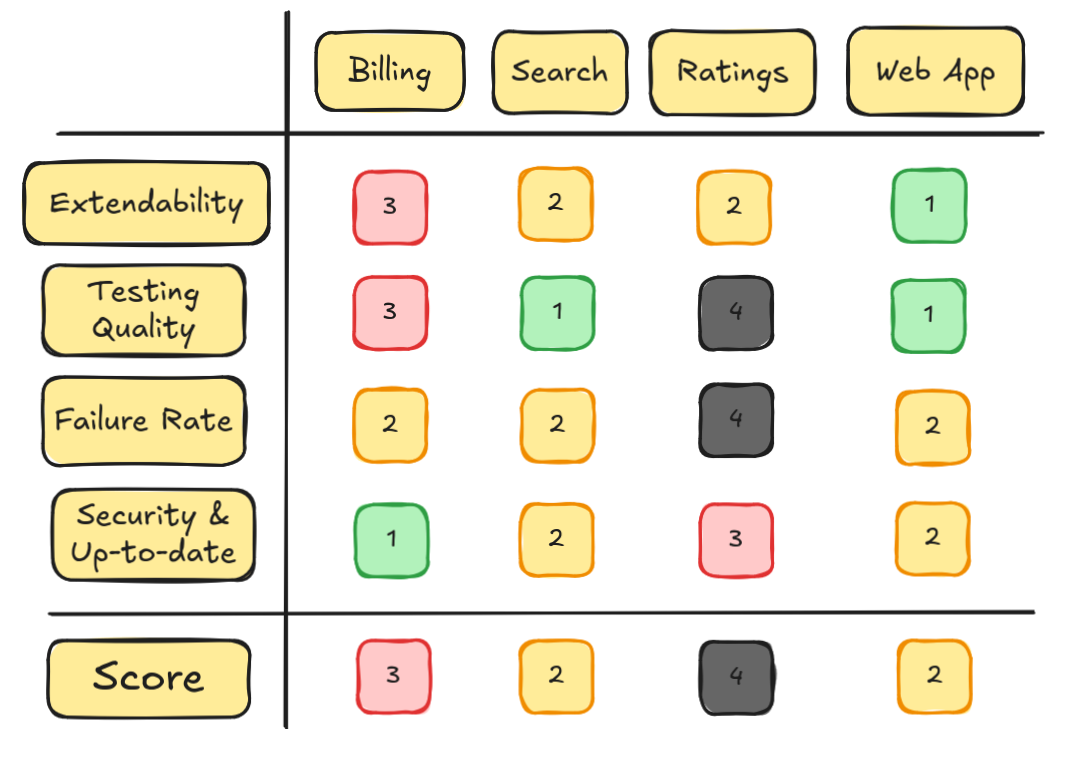 Completed service health map (numerical score added for clarity).
From what we've gathered, our web-app and search service are in a good
enough shape, at an acceptable point for a production app.
However, the billing and ratings services are in trouble. The ratings service has strong ongoing issues, with a very high failure rate, lurking
security issues and no useful test base to help us overcome these problems.
Should we jump in and plan the work to get these services into shape during next iterations? First, we should ask ourselves: is it worth it?
Session #2 prep - Considering bussiness importance
If we only cared about perfection, it would be great to fix all the problems we've found. But with limited time, capacity and rapidly
switching objectives, we have to compromise.
Before starting to plan how to fix the issues we've found, first we had to understand if doing it makes sense from a business perspective.
To do so, we scheduled a short follow-up session with product and business specialists from our team.
We listed the product features that are backed by our team's services, and sorted all features by business importance,
using a numerical scale as we did with the technical services.
Ranging from 1 (▣), meaning a feature that's very important for the business, to
3 (▣), meaning it's just a nice-to-have.
To support this classification, we used a variety of metrics our product experts had in hand. Some of them were:
- Usage numbers
- How many users do actively use the feature? (DAU / MAU)
- Are the users making use of the feature important for the business? (paying customers, important contracts...)
- Revenue Generation
- What is the impact of the feature in terms of revenue, regardless of usage?
- What would happen to revenue if we stopped supporting it?
- Compliance & Strategical Opportunity
- Is this feature a regulatory requirement in key markets?
- Does supporting it keep users from leaving the platform?
- Is it a requirement for an important contract with a major customer?
With the list of features in hand, sorted by their business relevance, we can prepare the next workshop session: matching each
product feature with its backing service.
Session #2 - Evaluating technical / business health
In this session, we will complete linking the business relevance of each product feature to the services supporting them.
To build this mapping, the steps we follow are:
- Build a matrix with all services as rows and product features as columns.
-
Sort both services and features with descending health and relevance (top left corner for best, bottom right corner for worst).
- Use the color key to help visualize health and relevance at a glance.
-
Place a pin in each cell where a product feature is backed by a service.
- In the following example, Feature A is backed by Services 1 and 2.
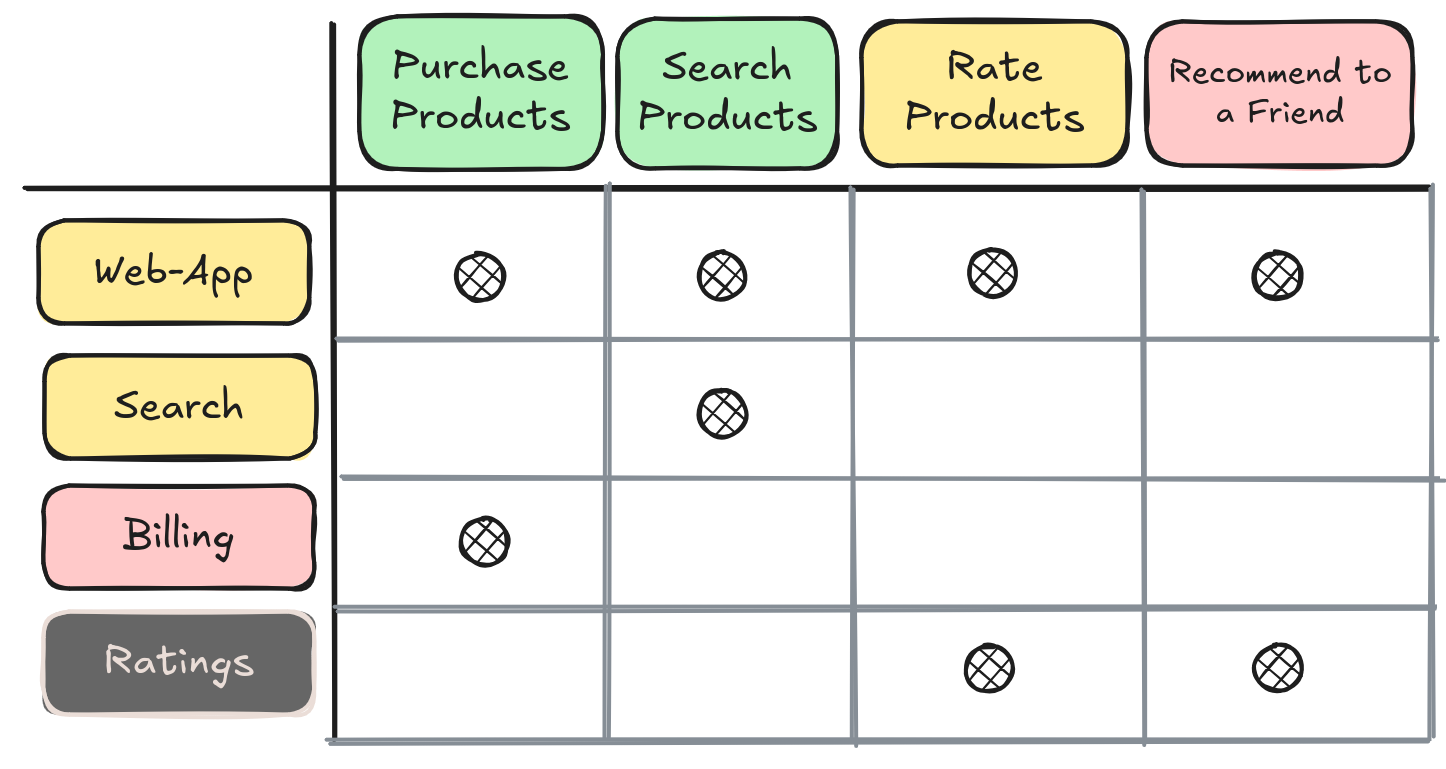
The resulting matrix will look like this:
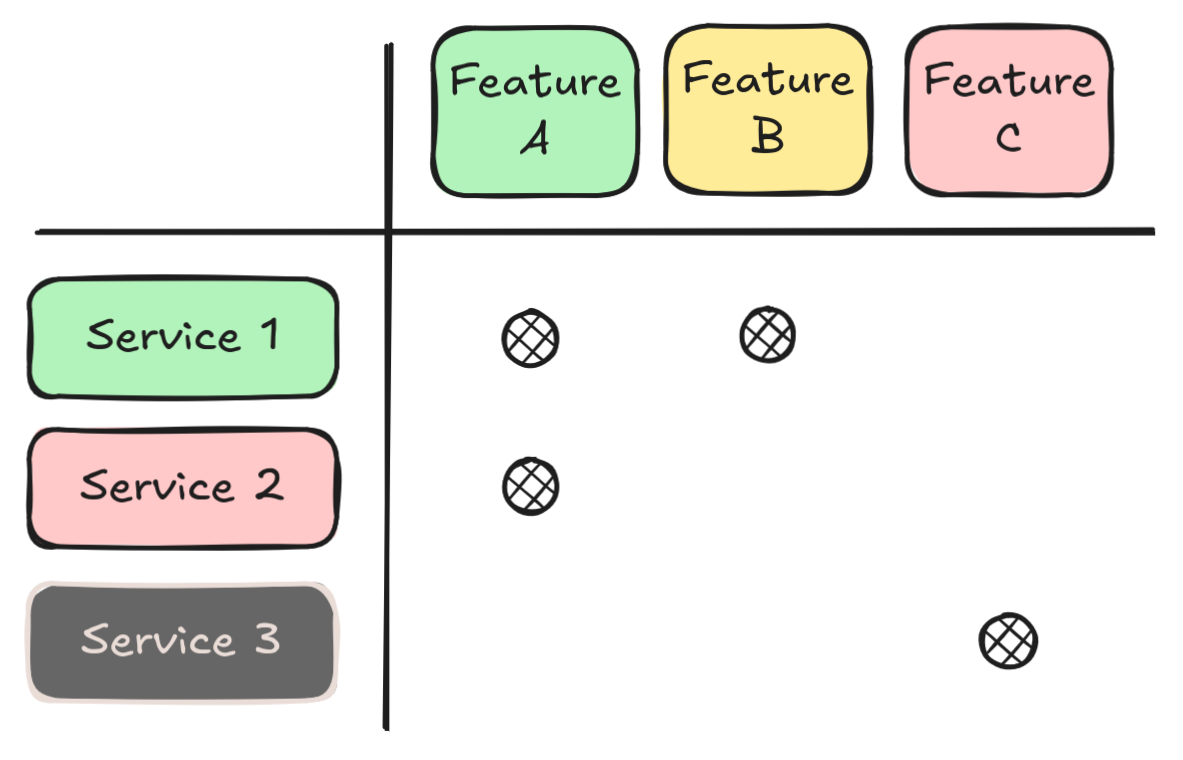 Mapping product features against services.
With this information at our disposal, it's time to start making decisions on what's worth fixing and what's not. We'll focus
on looking for features that have:
- Good health + business relevance.
- Bad health + business relevance.
- Bad health + questionable business relevance.
First, we have the best-case scenario: features that are relevant for the business, which are supported by
services that have good health.
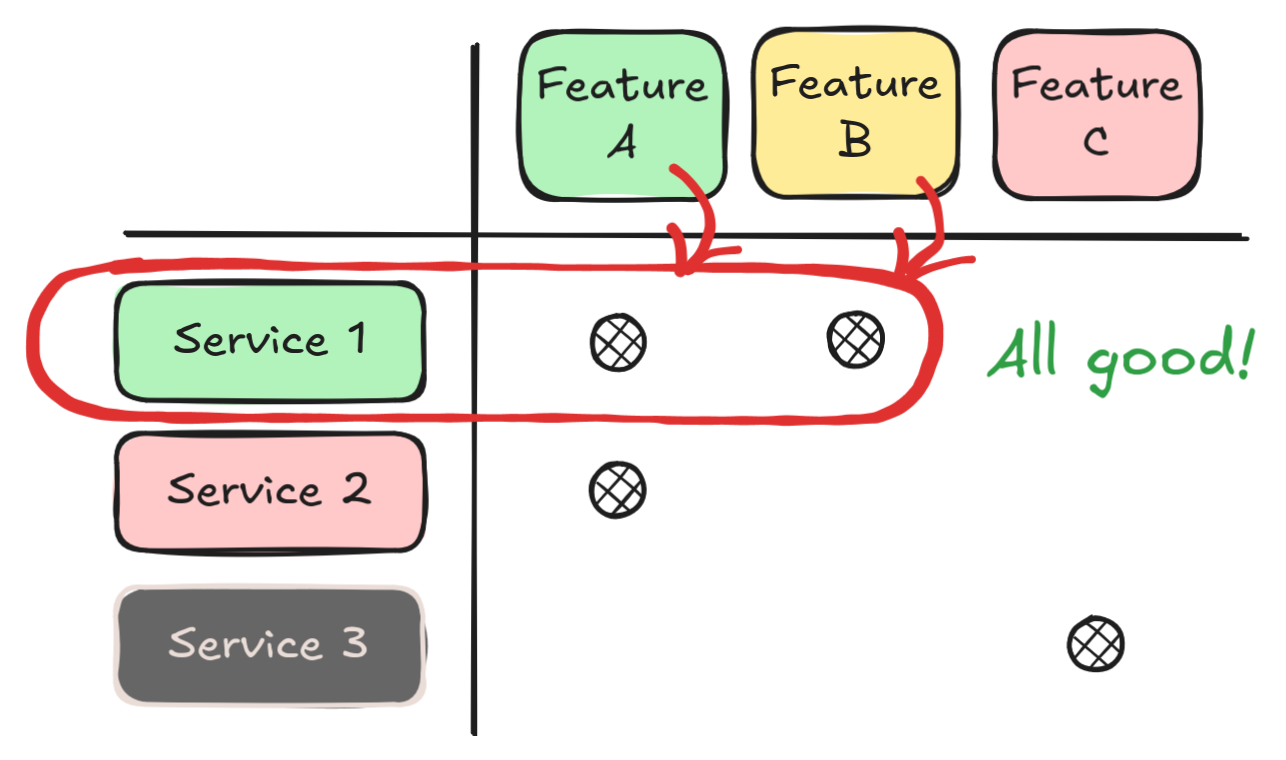 No need to worry about these.
We can safely ignore these and just keep up the good work. If there are any new features, unexpected regulatory changes
or required updates, we will be able to handle them without problems.
Next, let's focus on the danger zone.
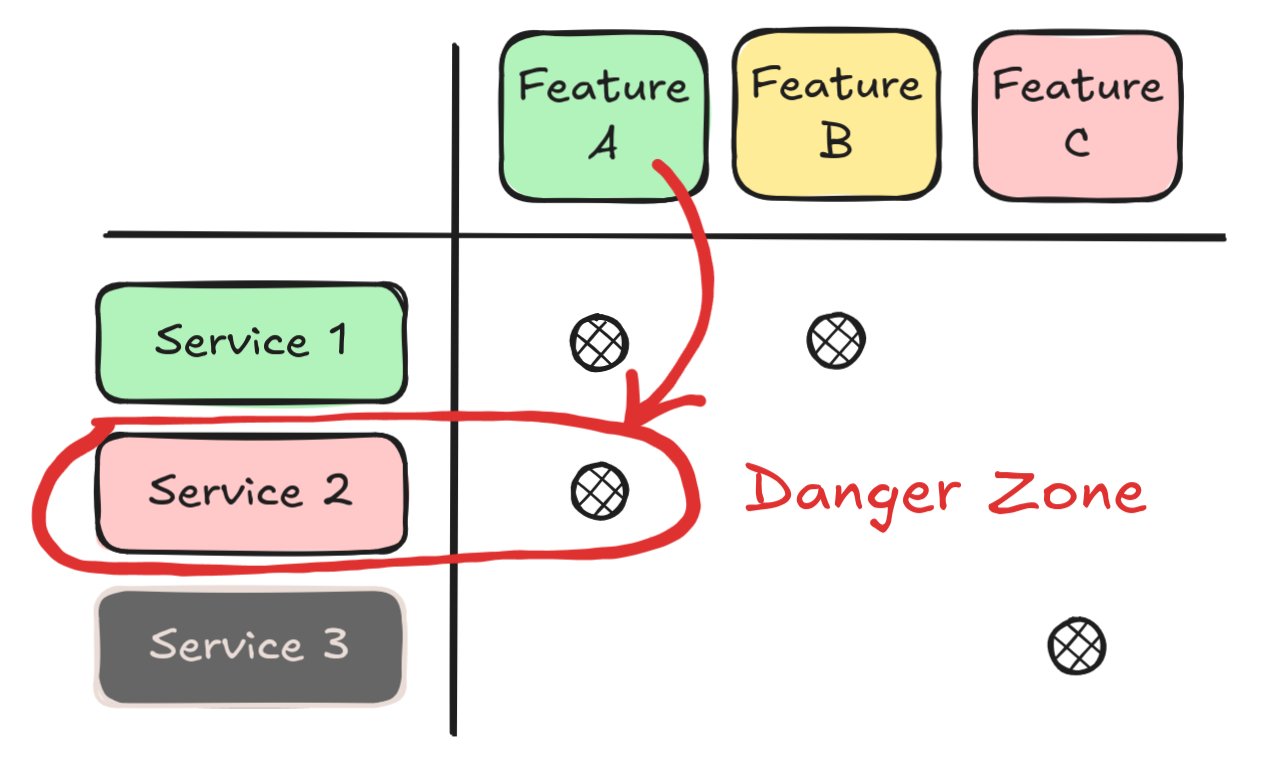 We could be in trouble if something goes wrong with these.
These are product features that are relevant for the business, but are backed by services that are in poor health.
We should be looking forward to fixing the issues we've detected as soon as possible.
In the last group, we have those that should open a conversation around: is supporting these features even worth it?
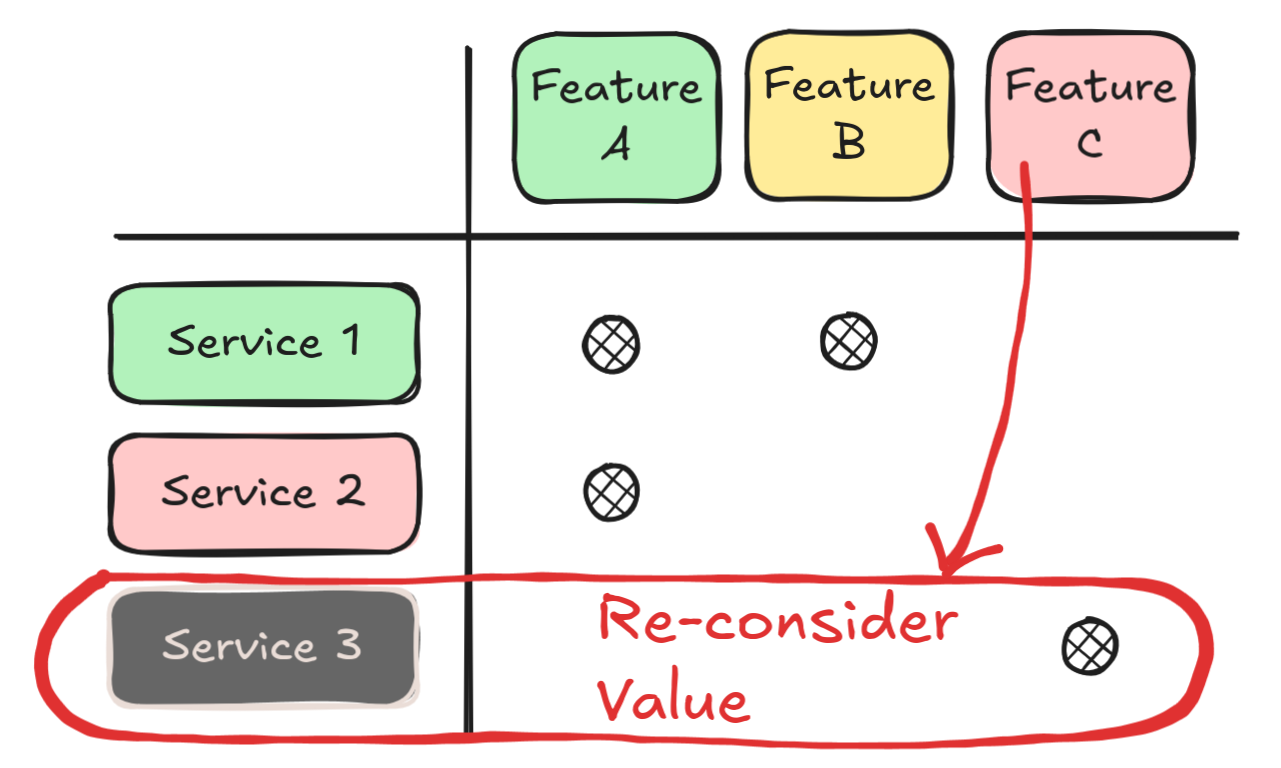 Why are we investing resources on this?
These are features that are not really relevant for the business, and are backed by services that are in bad shape.
Seeing your team get bogged down with bugs or incidents related to this kind of features might sound familiar.
In these cases, raising a discussion around the feasibility of directly stopping support for them might be worth it.
The key takeway to raise is: what is costing the business more money? Keeping these features alive, or the value generated by them?
Session #2 - Example case study
Let's assume there are four features backed by the services we enumerated in the first session:
- Purchase → Web-app + Billing
- Search → Web-app + Search
- Rate → Web-app + Ratings
- Recommend to a Friend → Web-app + Ratings
 Completed service health map (numerical score added for clarity).
The purchase products and search products are the core features of our e-commerce, and the business can't operate without
them.
Rating products is a nice-to-have feature, many users make use of it and it helps customers navigate the listings on the platform.
Last, recommending products to a friend was an experimental feature and isn't used almost at all, besides for a minority of users.
What results can we extract from the map?
- Purchase Products
- We have a problem in our hands.
- This is the core feature of our business.
- However, it's backed by the billing service which has severe issues.
- Search Products
- Nothing to worry about!
- Backed by services in good health.
- Core business feature with high value.
- Rate Products
- It's a nice-to-have feature, but not a business core feature.
- At the same time, it's backed by a service in a terrible shape.
- Recommend Product to a Friend
- Has very little business value.
- It's a major source of technical headaches for the team.
Now we know where we stand, the problems we have in our hands and which should be addressed urgently.
Tracing an action plan
The goal of this workshop is creating a plan to get out of this situation. The data we've
collected tells us where we should start, but not what to do.
The steps you will have to take as a team to fix the problems in your services and product features will vary greatly
depending on the kind of problems you've found.
To illustrate through an example, take the conclusions from the example case study. Let's begin
with the purchasing products feature.
Going back to the results of the first workshop (service health map), we can trace a plan to ensure the service backing
this feature, the billing service, has the expected quality.
The service has severe extendability and test coverage issues, plus security problems. If we want to avoid future problems,
a good starting point could be:
- Improving its test coverage to avoid regressions when adding new features or fixing bugs.
- Using the newly improved test coverage, refactor the codebase to facilitate its extendability.
- Resolve the ongoing security issues, before we get a severe incident on our hands.
We can plan these improvements as part of our iterations, leaving some headroom so we can advance steadily. We can use the data discovered
during this workshop to negotiate the budget.
Regarding the other two pain-points, the rate products and recommend product to a friend features, we can apply the
same steps.
The ratings service has abysmal quality and a very high failure rate. Either we improve it, or we discard the features that are not
relevant to the business. The key resides in evaluating the tradeoffs from both options.
Reflecting on the results
In our case, this workshop helped us understand where we standed and put us in the right mindset to
start working on our ongoing issues.
At times when there are too many problems on the table, having data neatly laid out helps a lot with creating a clean mental
model and making better decisions.
After sharing the workshop with other teams within our organization, they tried it out and had positive results. Adapting it to their
needs was key.
If you are going through a similar situation in your organization, I hope this serves as inspiration to attempt this workshop with your team
and get the ball rolling.
And of course, if you try it out and do anything differently, or have any ideas on how to improve it, I would love to hear them.
If you've made it this far, thank you so much for reading!
If you have any comments, suggestions or want to discuss any of the topics in this article,
feel free to reach out through any of the channels in the top of the page.


